Houston Market Snapshot - March 2025

For this month’s market snapshot I get into the trend(s) I see from HAR.com Weekly Actvity Snapshot for this year-to-date.
I uploaded each week’s Snapshot into ChatGPT, and created a few graphs.
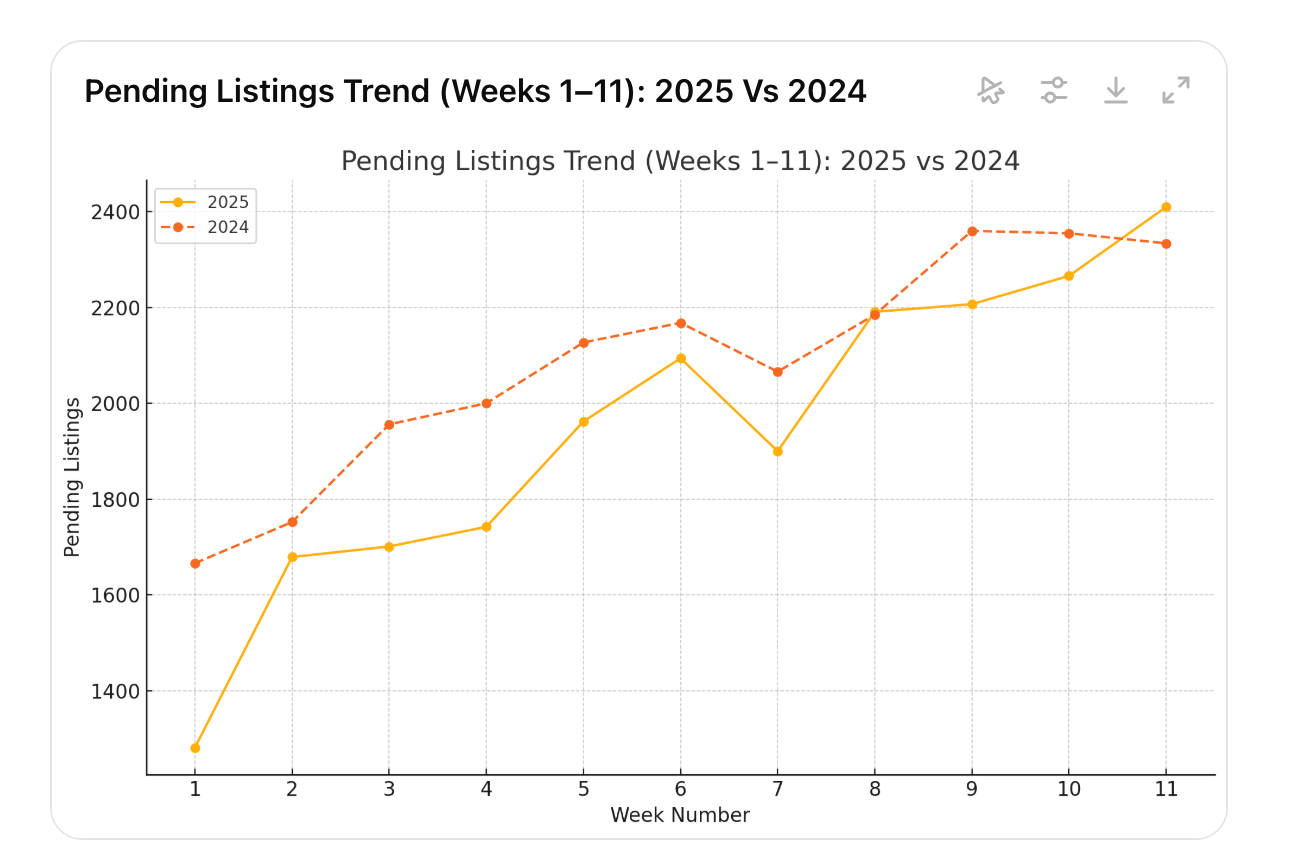
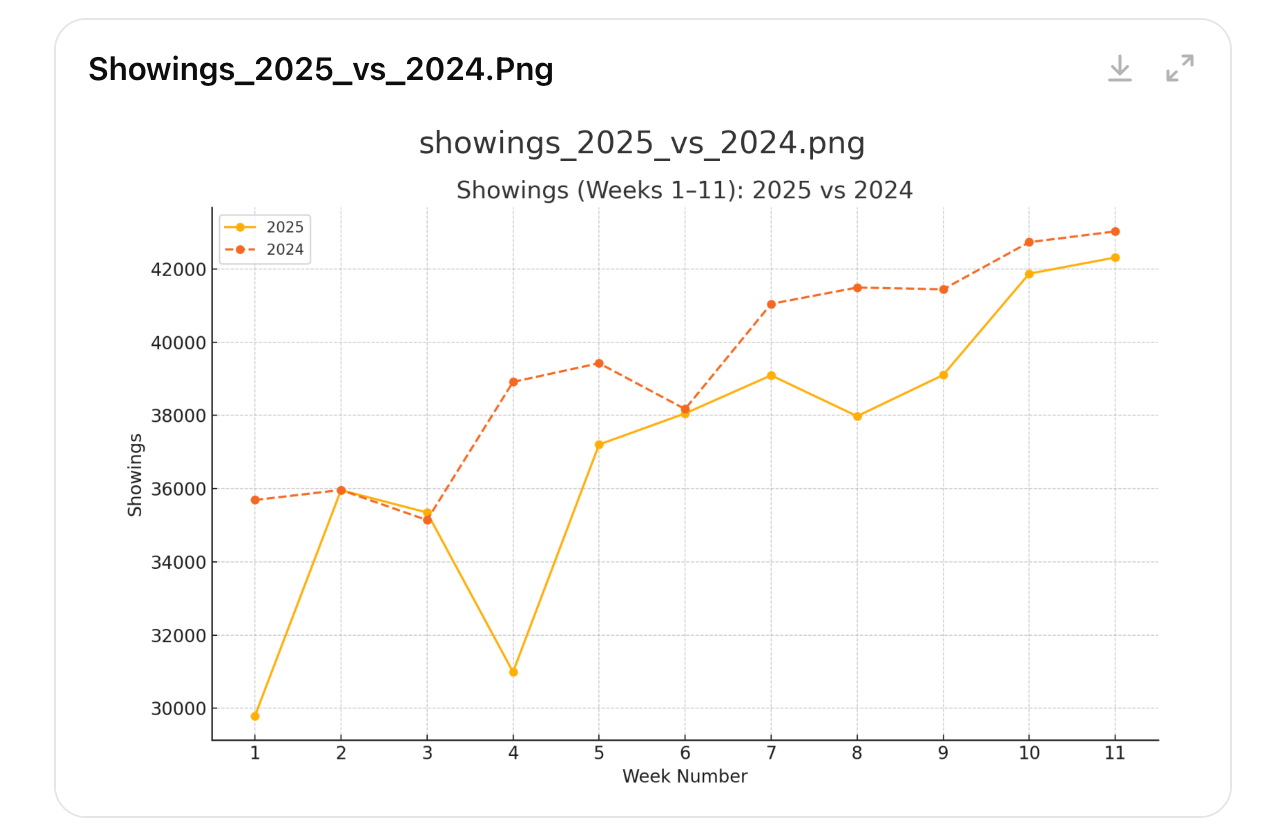
We like to look at Pending Listings to get a pulse on where buyer demand is at. And through the first 10 weeks of 2025, pending listings consistently lagged behind 2024’s numbers. It wasn’t until Week 11 that they finally caught up and surpassed last year’s volume. Showings have also trailed 2024 most weeks. These two facts considered together might make it seem like demand is down—but that’s not the whole story.
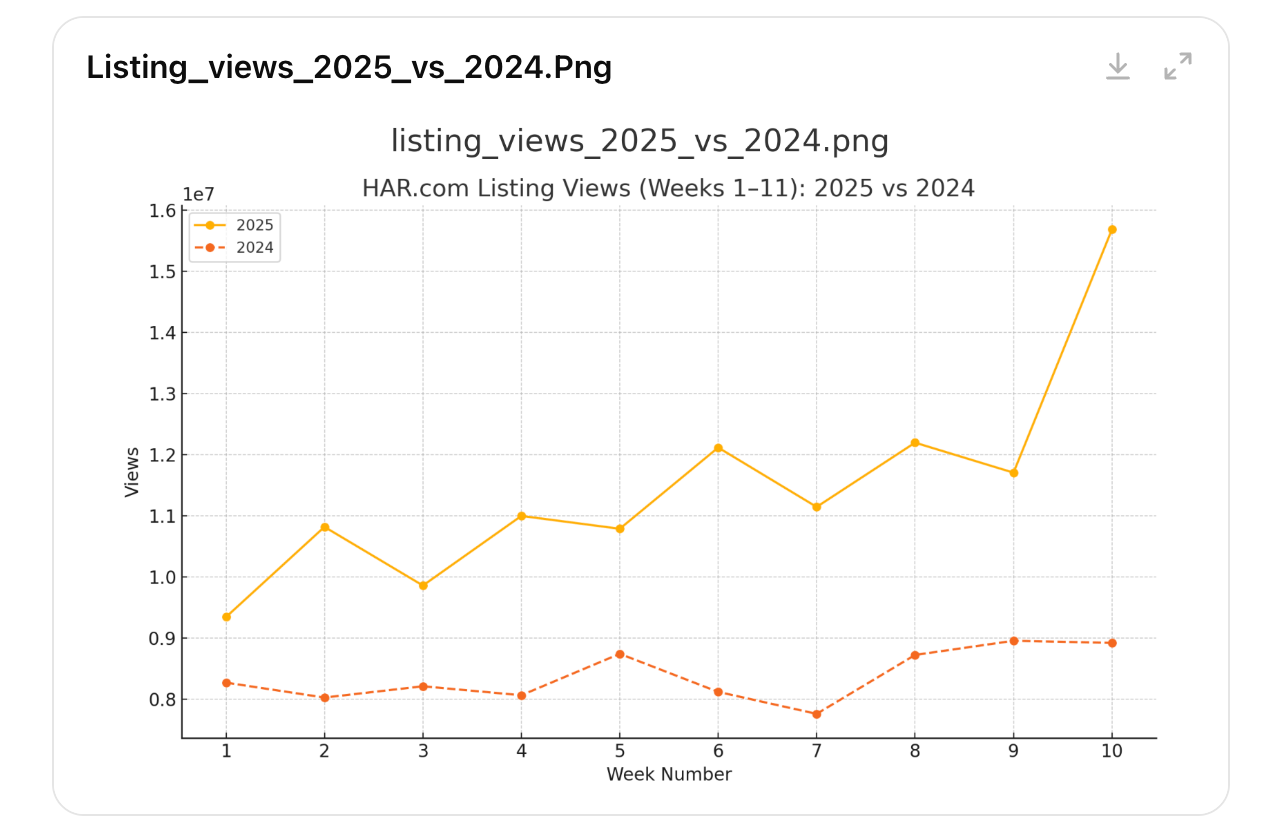
If you dig into HAR.com Listing Views, a different picture starts to emerge. Each week, listings have gotten 20% to 45% more views than they did this time last year. In Week 10, listing views were up a massive 75.9% compared to 2024. So while showing activity has been softer, a ton of buyers are clearly out there—window shopping, watching, and waiting.
Our take? A lot of would-be buyers are still sitting on the sidelines, waiting for interest rates to come down.
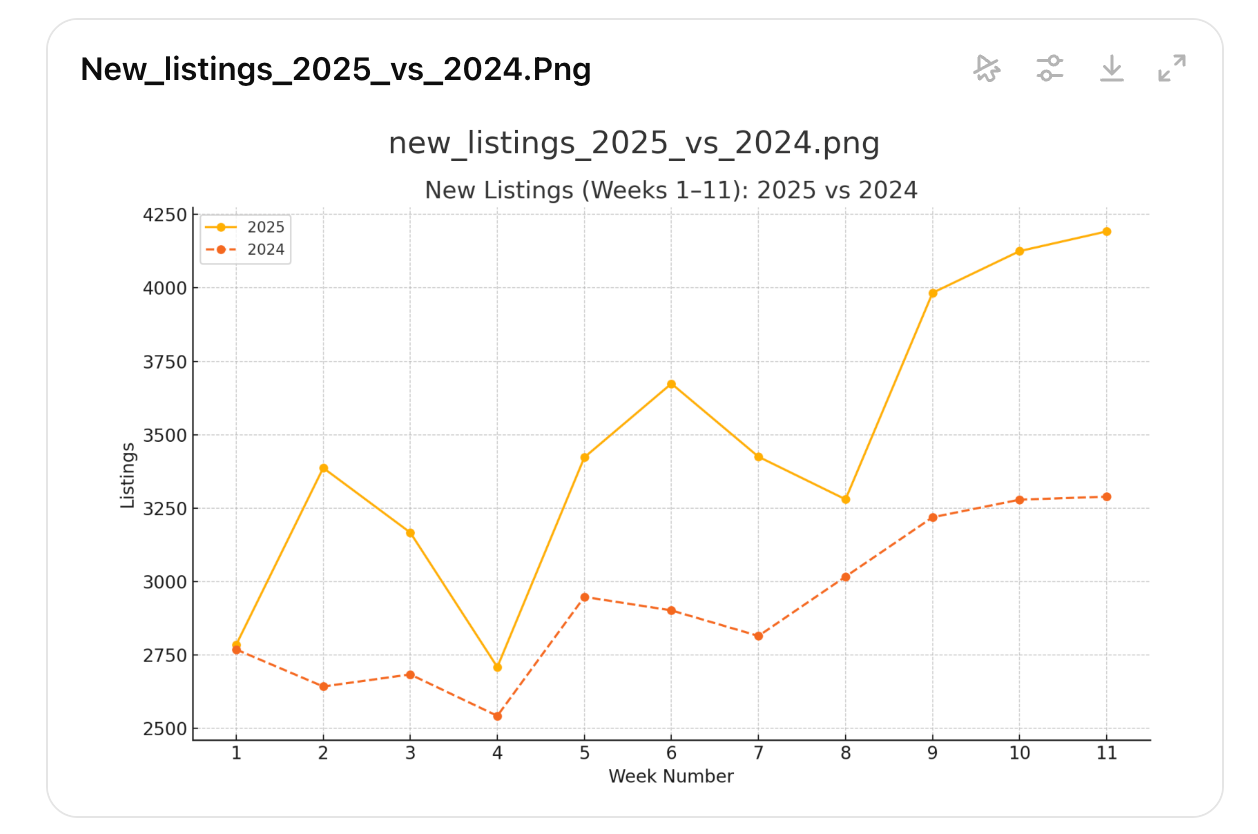
Meanwhile, on the supply side, New Listings have been on a steady rise since Week 8. This is something we're super happy to see, since record-low inventory has been the dominant theme for the past 2 years. Increased inventory will not only mean more options for buyers, but this should also translate into more buyer demand since many home sellers are buyers also.
We’re also starting to see showings pick back up, which is typical for spring, and gives us some optimism that the market is finding its way back to something more normal.
As of the time of this writing, the average 30 year fixed rate is 6.71% according to MortgageNewsDaily.com. If rates dip closer to 6% this year, this would probably translate into a super busy buying season.
As always, if you want to know what this means for your specific neighborhood, price point, or plans—reach out. We’d be happy to talk through the strategy.

January 23, 2026
Rates, Inventory, and Buyer Demand Trends Heading Into the 2026 Spring Market

December 18, 2025

October 17, 2025

August 20, 2025

June 19, 2025
May 15, 2025
Our expansive network and white-glove service ensure a bespoke experience for both buyers and sellers. Let our top producing team find your dream home today.